Snow Forecast

View detailed snow forecast for Perisher at:
snow-forecast.com
Snow Camera - Top of Valley
|
|
View detailed snow forecast for Perisher at:
|
|
|
|
|
|
|
The maximum depth of the winter snow in the Australian Alps varies from year to year. If these variations were random, then the best guess for next year's maximum snow depth would be the average depth. If a linear trend and some cyclical factors are present, then it should be possible to quantify these, and make a better guess. However see the Trend Analysis, especially the final paragraph.
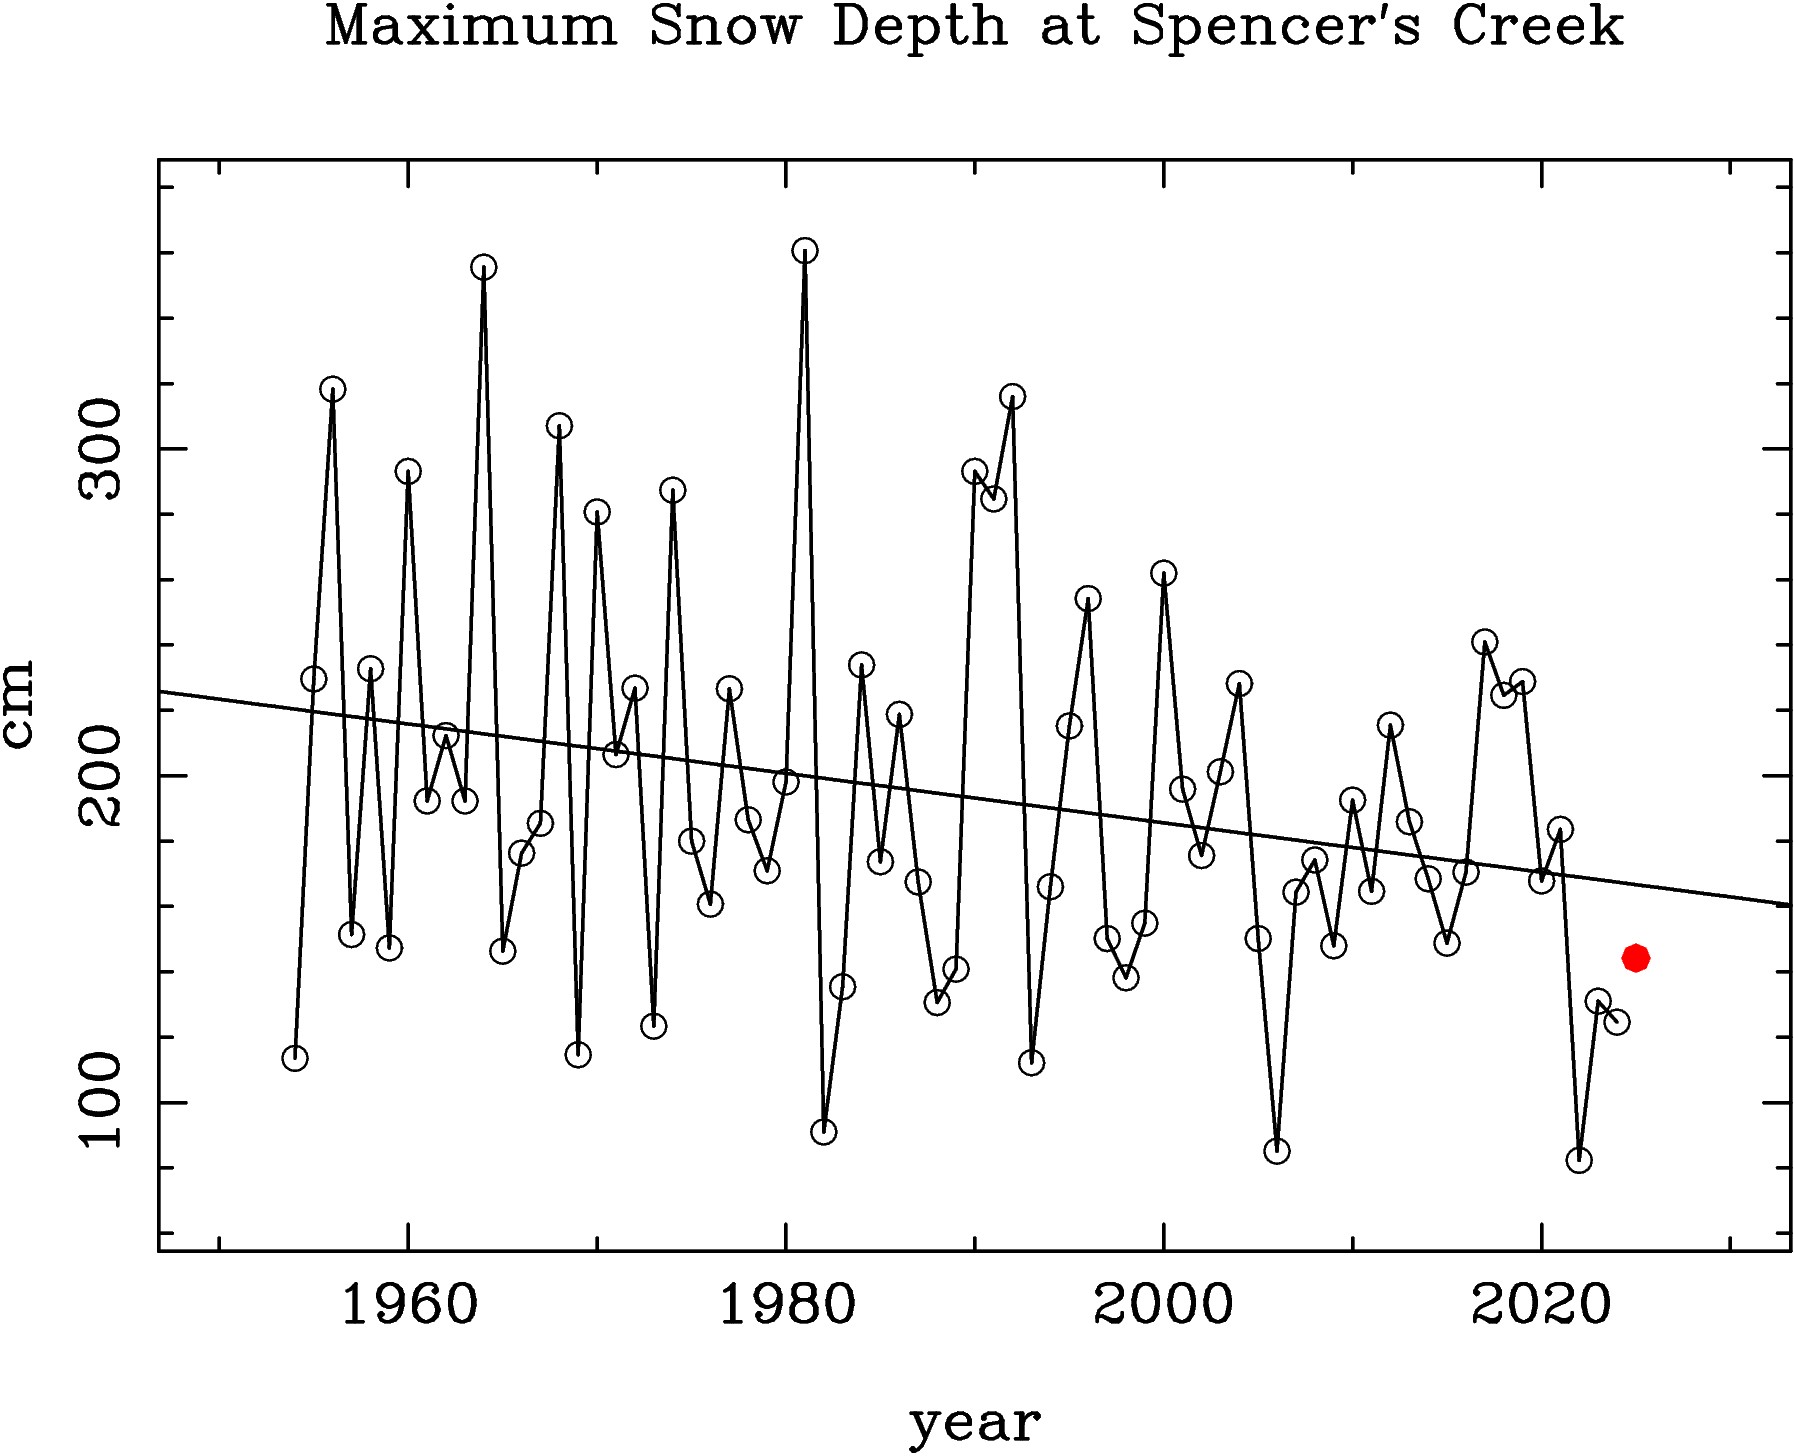
From inspection of Figure 1, it appears that an exceptionally good year
is often (but not always) followed by several poor years,
and that there appears to be a systematic decrease in snow depth with
time. I have analyzed the year to year fluctuations assuming that, in
addition to a purely random component, there are periodic components
which can be derived from the historical measurements, and
that these can be used to predict future behavior.
In addition to random fluctuations, a decrease of 7.6 cm/decade and
cyclic components with periods of about 4 years were found, and
used to predict the maximum snow depth for next year.
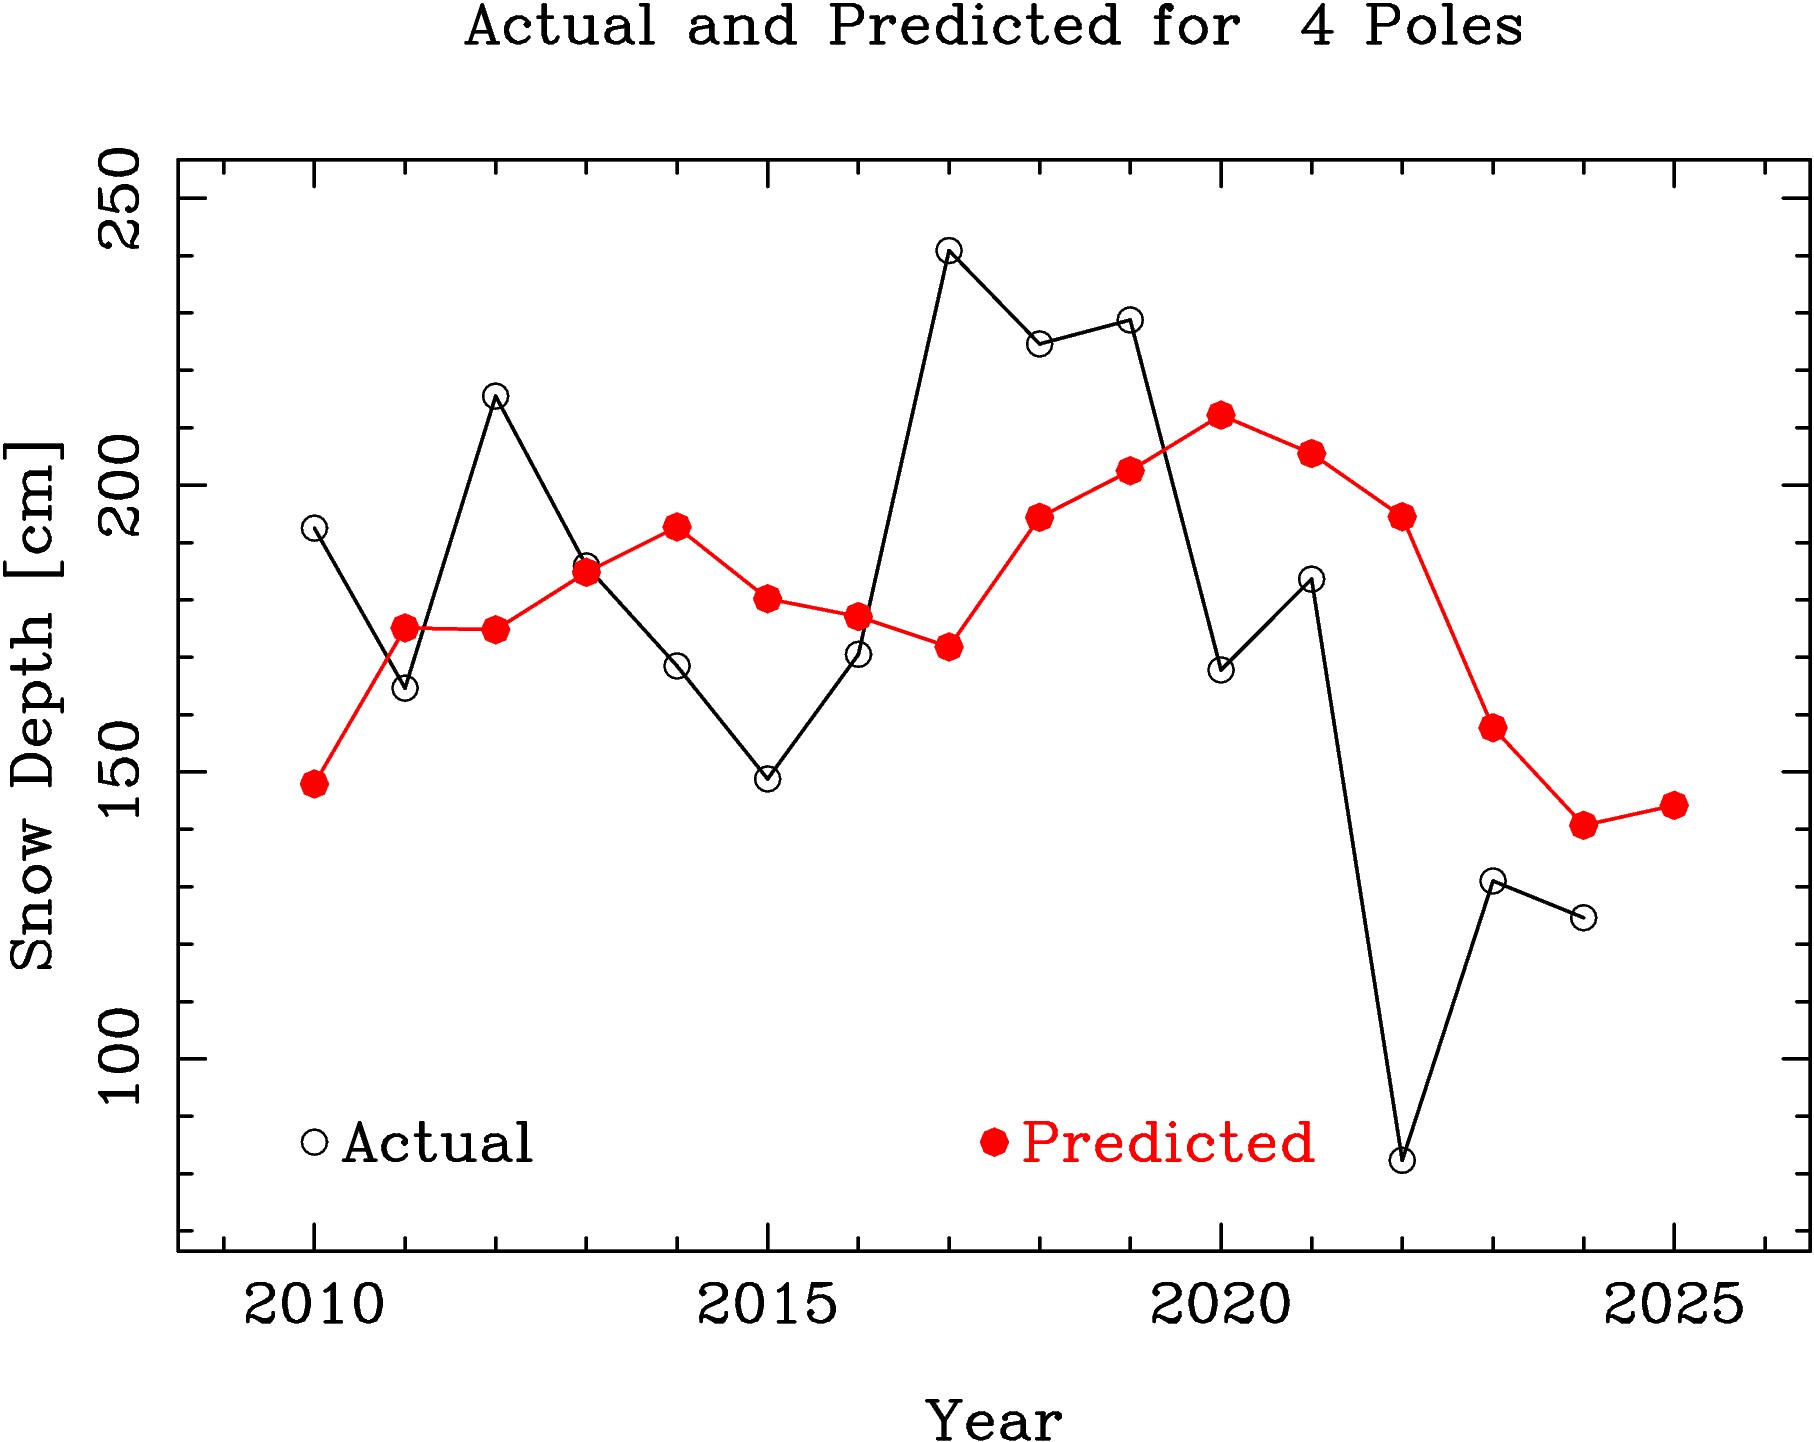
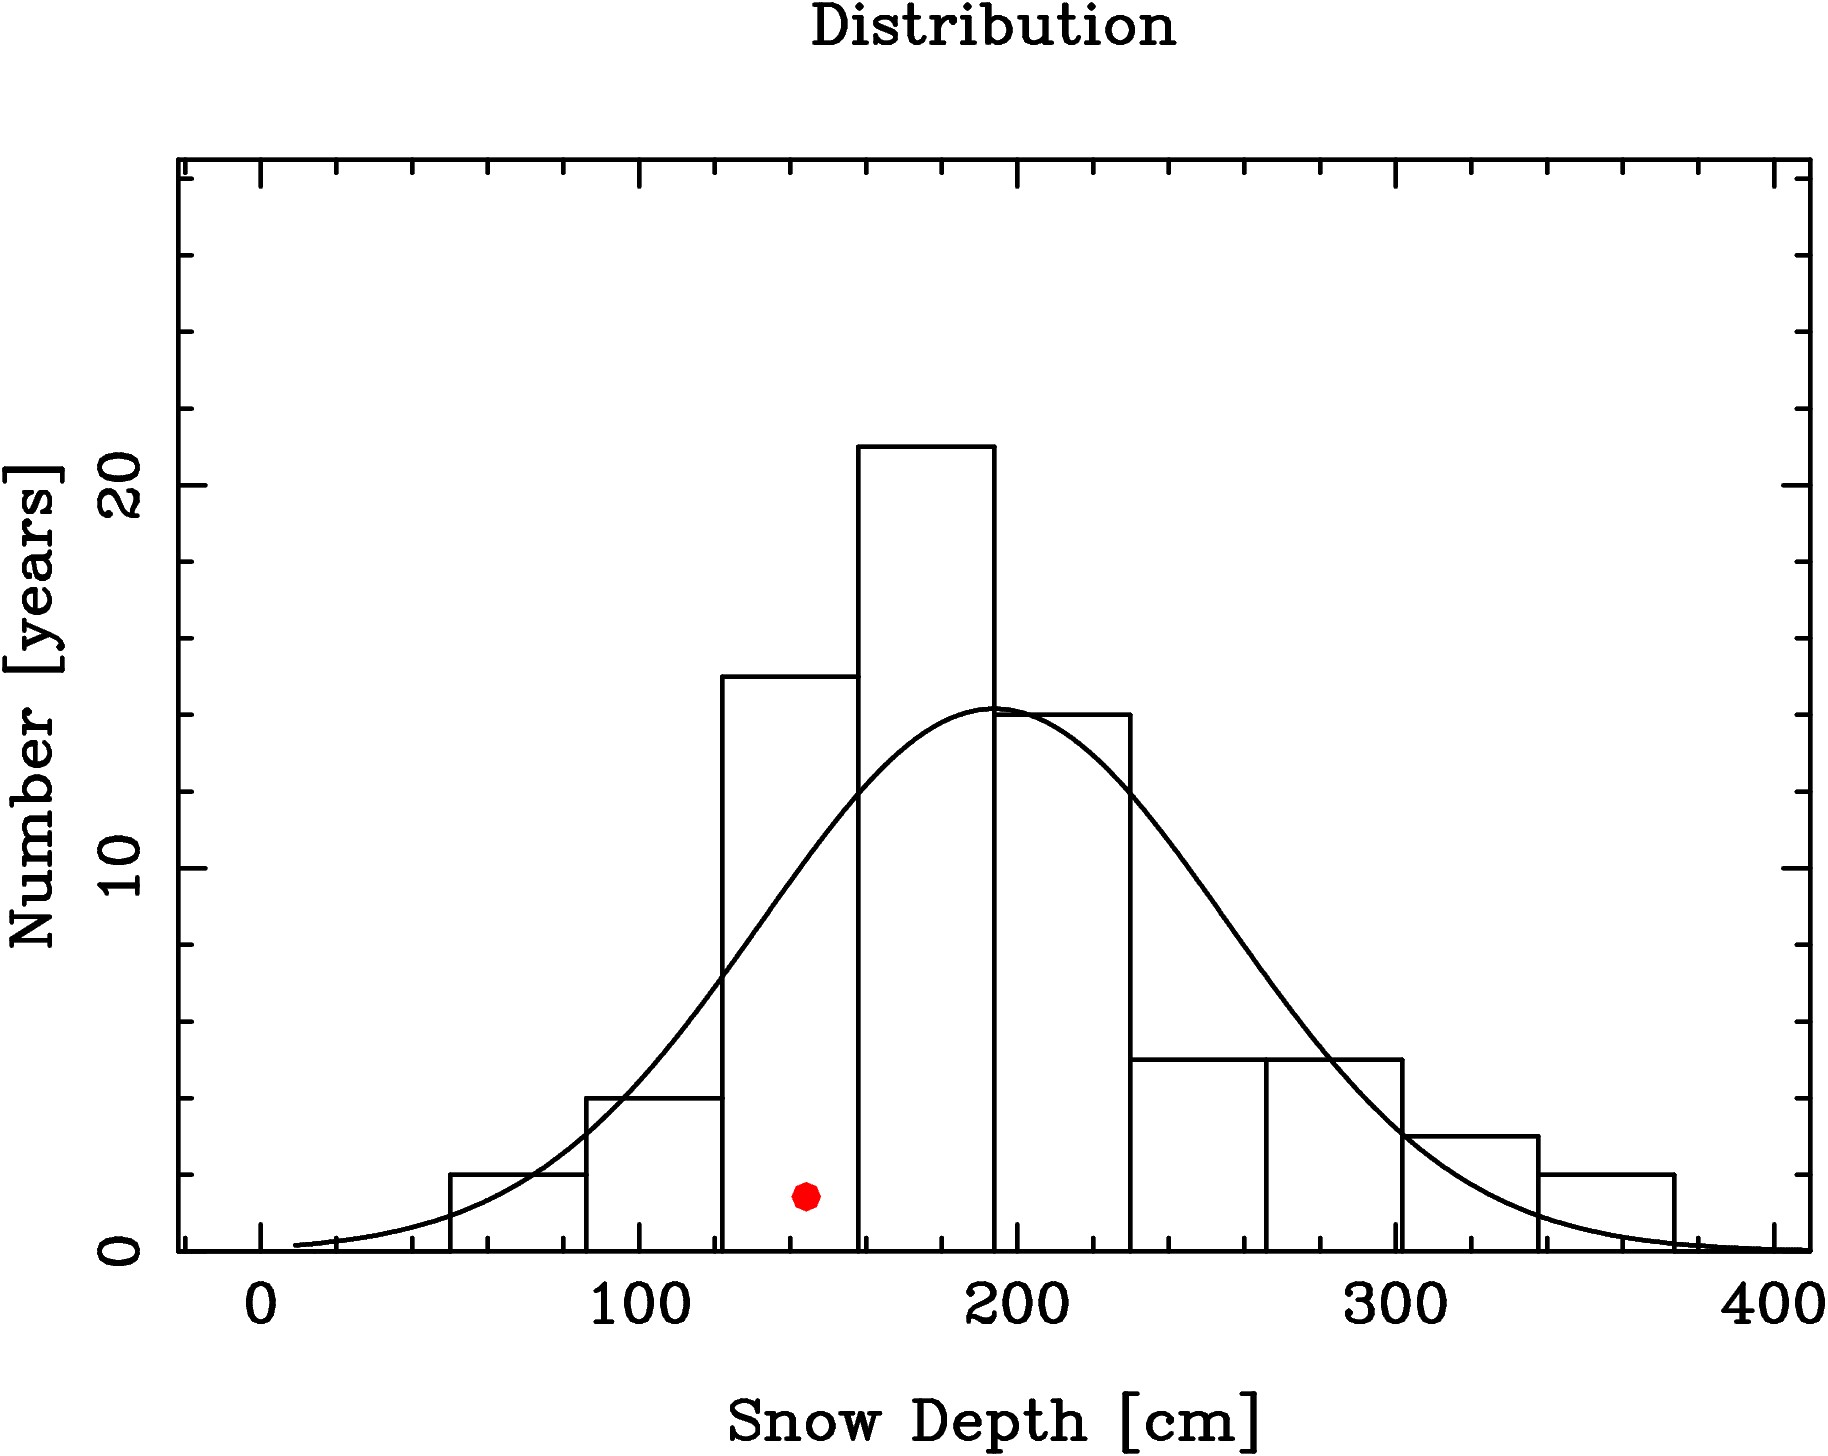 As can be seen in Figure 2, years with below average snow depths occur more often than expected from purely random variations, as do exceptional years with depths exceeding the average by more than 100 cm. The prediction for 2025, based on the measurements from 1954 through 2024, is for a maximum snow depth of 144.2 cm, which is 49.7 cm less than the 71 year average of 193.9 cm, 22.5 cm less than the 166.7 cm expected from the decreasing linear trend, and 19.6 cm above the actual 124.6 cm in 2024. We can expect the 2025 snow depth to be below the long term average, slightly below the liner trend, and slightly better than last year. I computed the maximum entropy and linear prediction values made with a varying number of poles, and found that the minimum of root-mean-square differences between the predicted and actual values was obtained using only 4 or 5 poles.
|
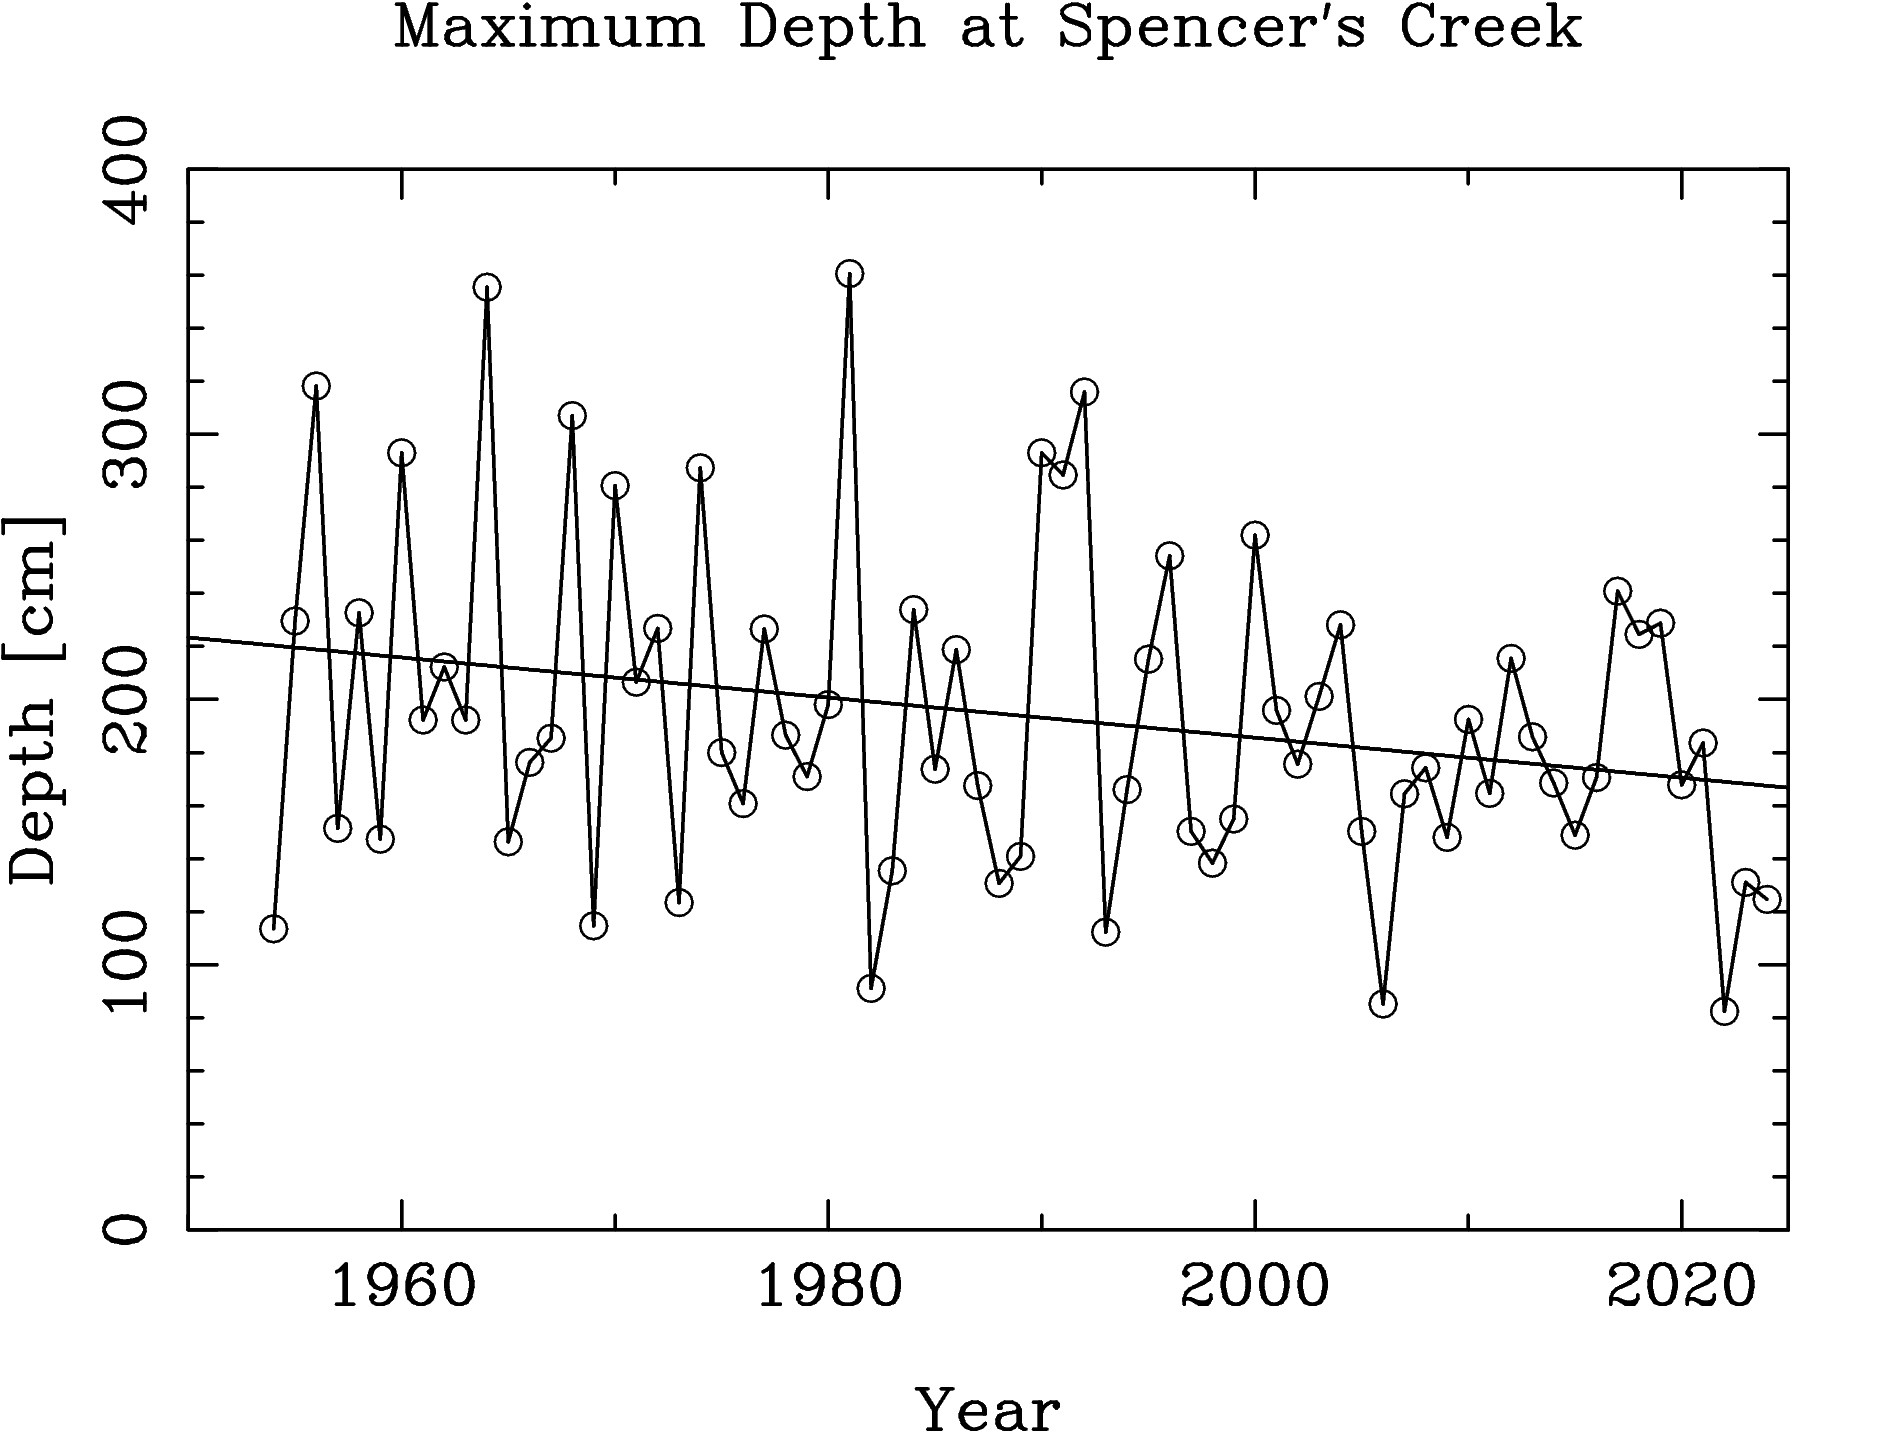 The line has a slope of 7.6 cm/decade. With a probable error of 3.5 cm/decade. The data were divided into three periods,
plots made of the snow depth distributions for each period,
and some statistics calculated
from the data of each period. 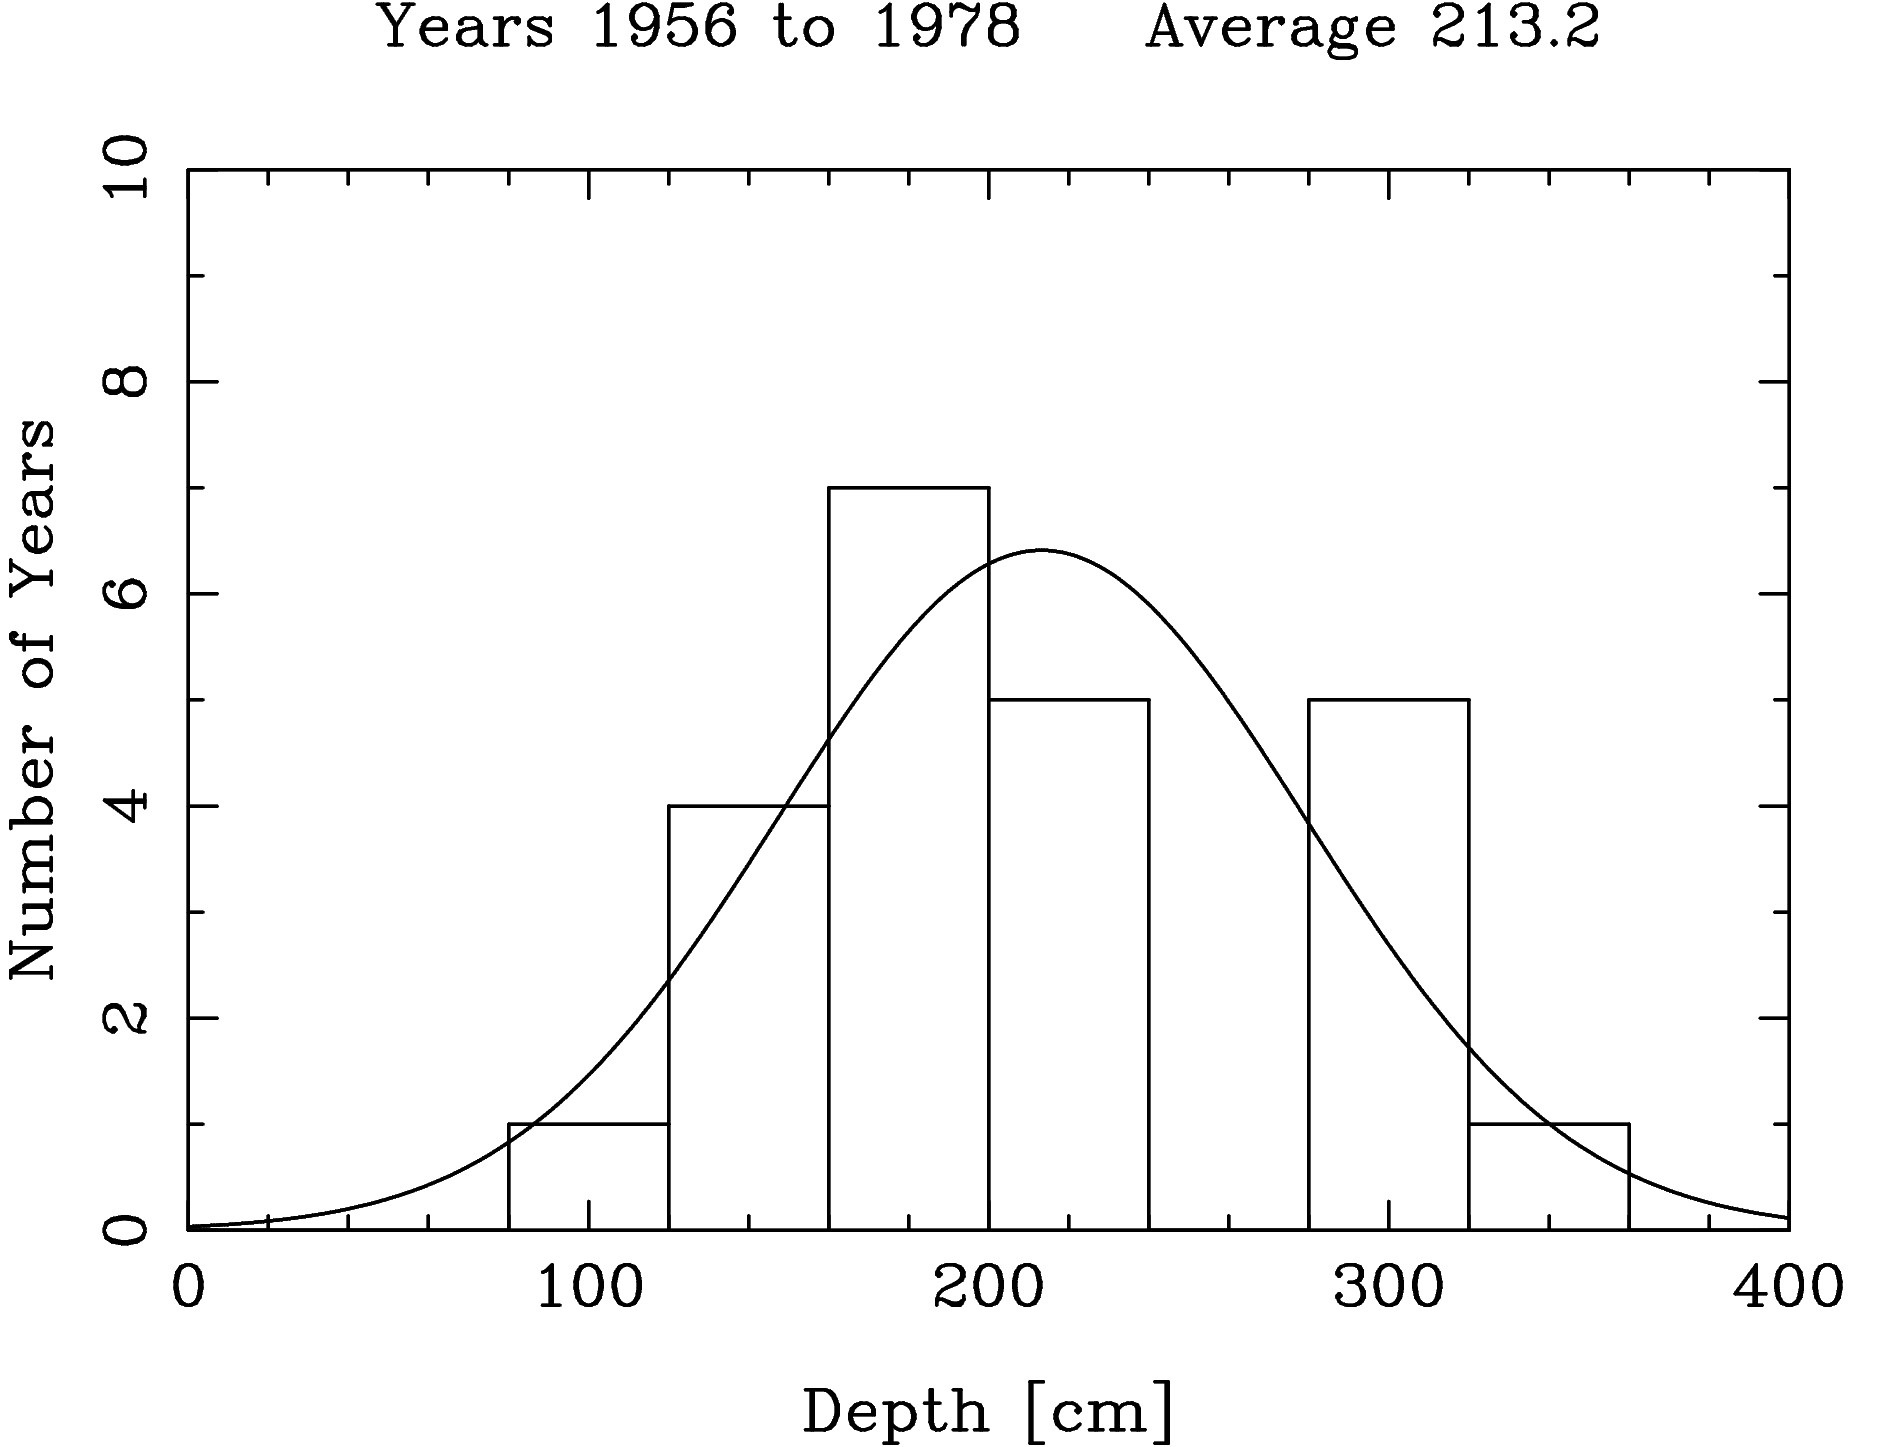
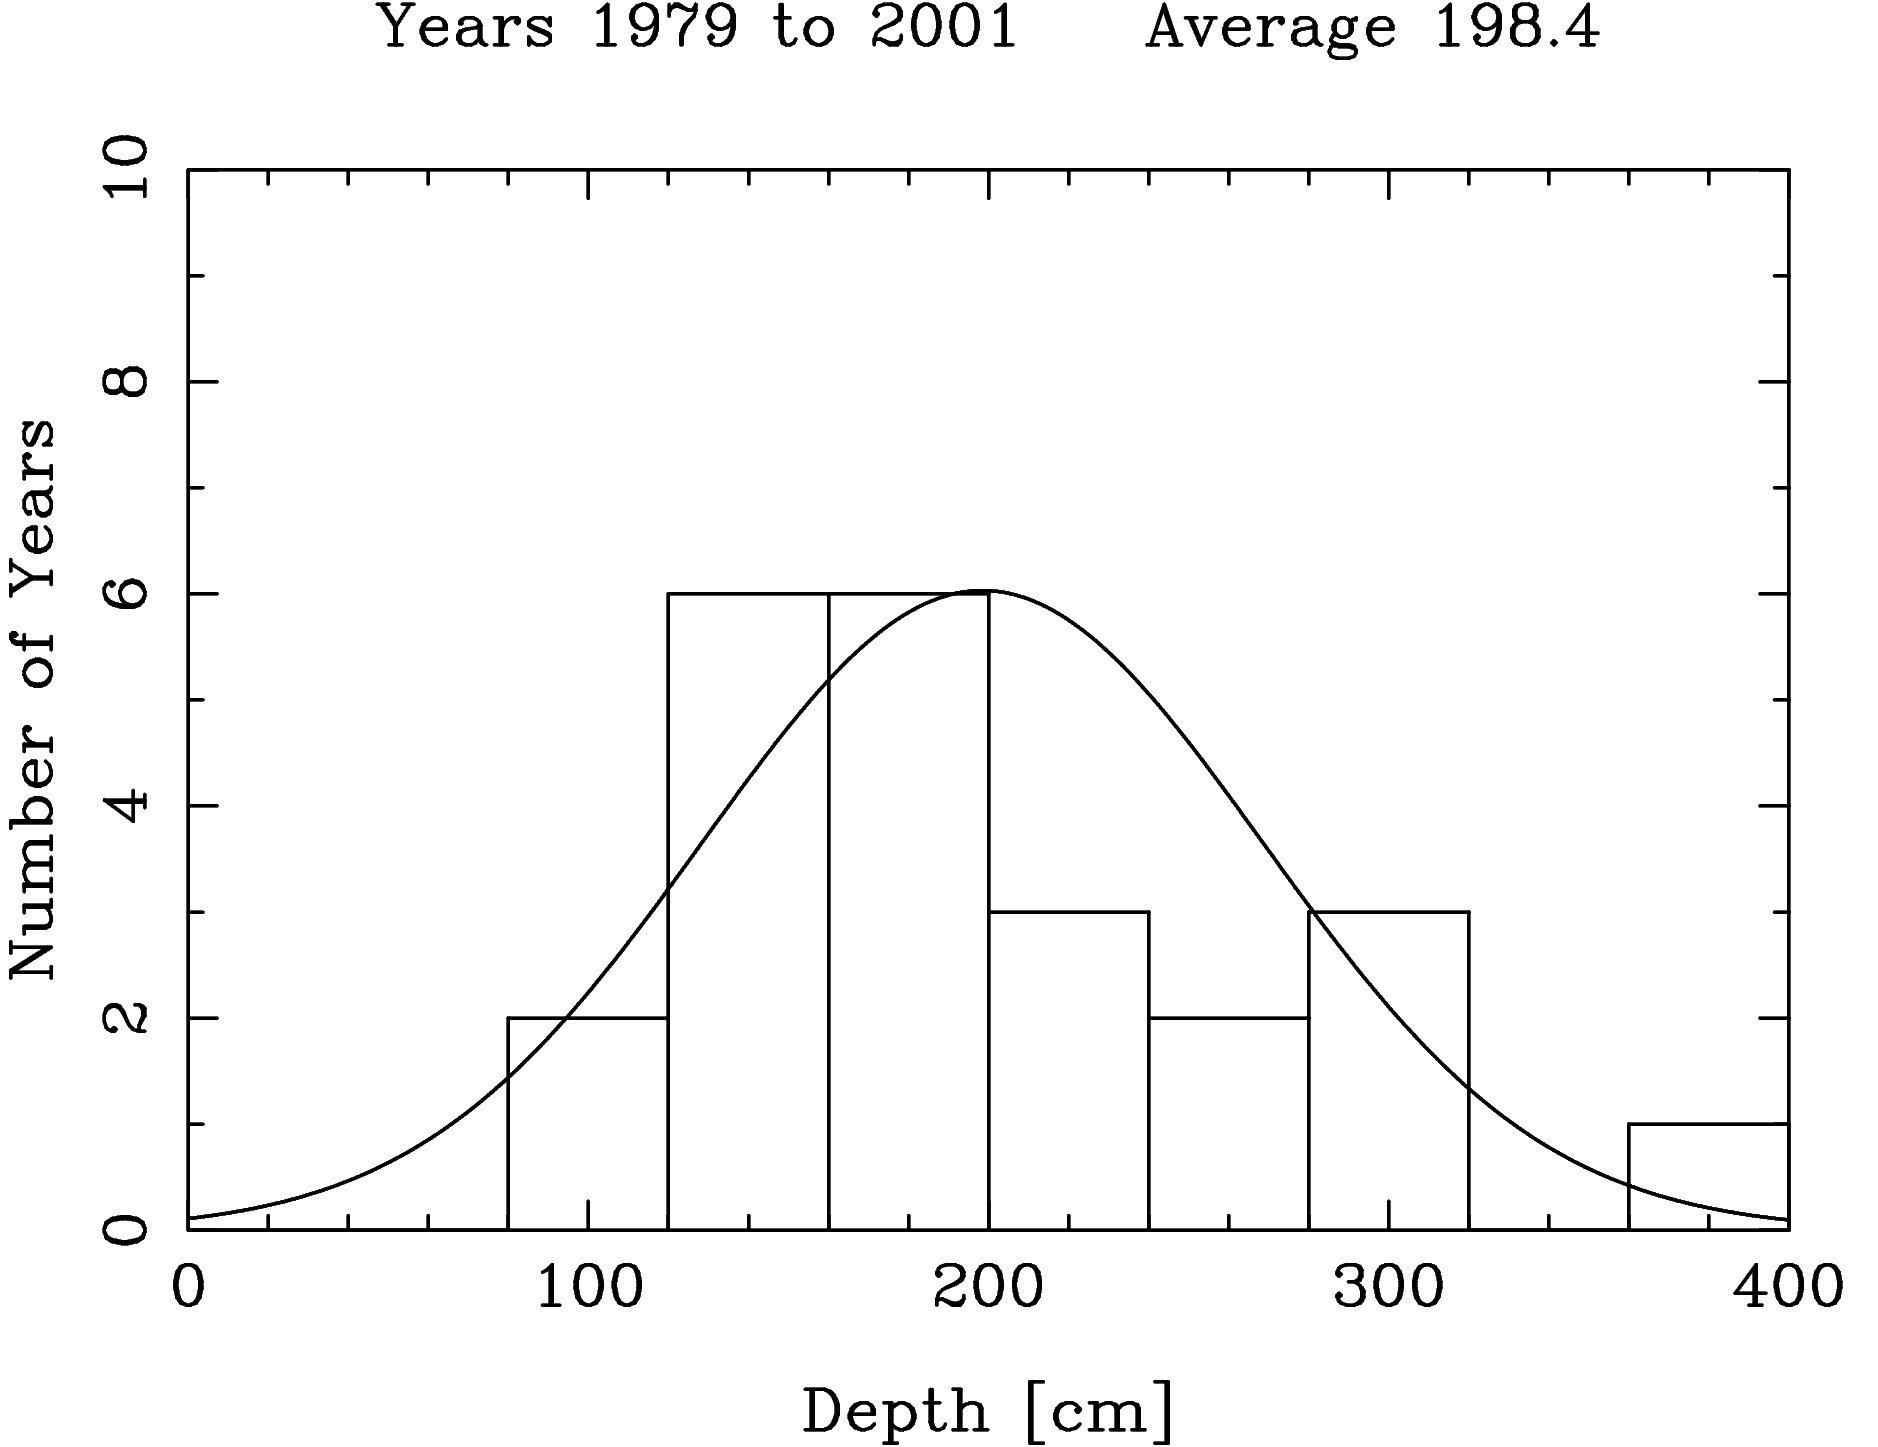
Note that the first two periods (
1956-1978 and
1979-2001) have an
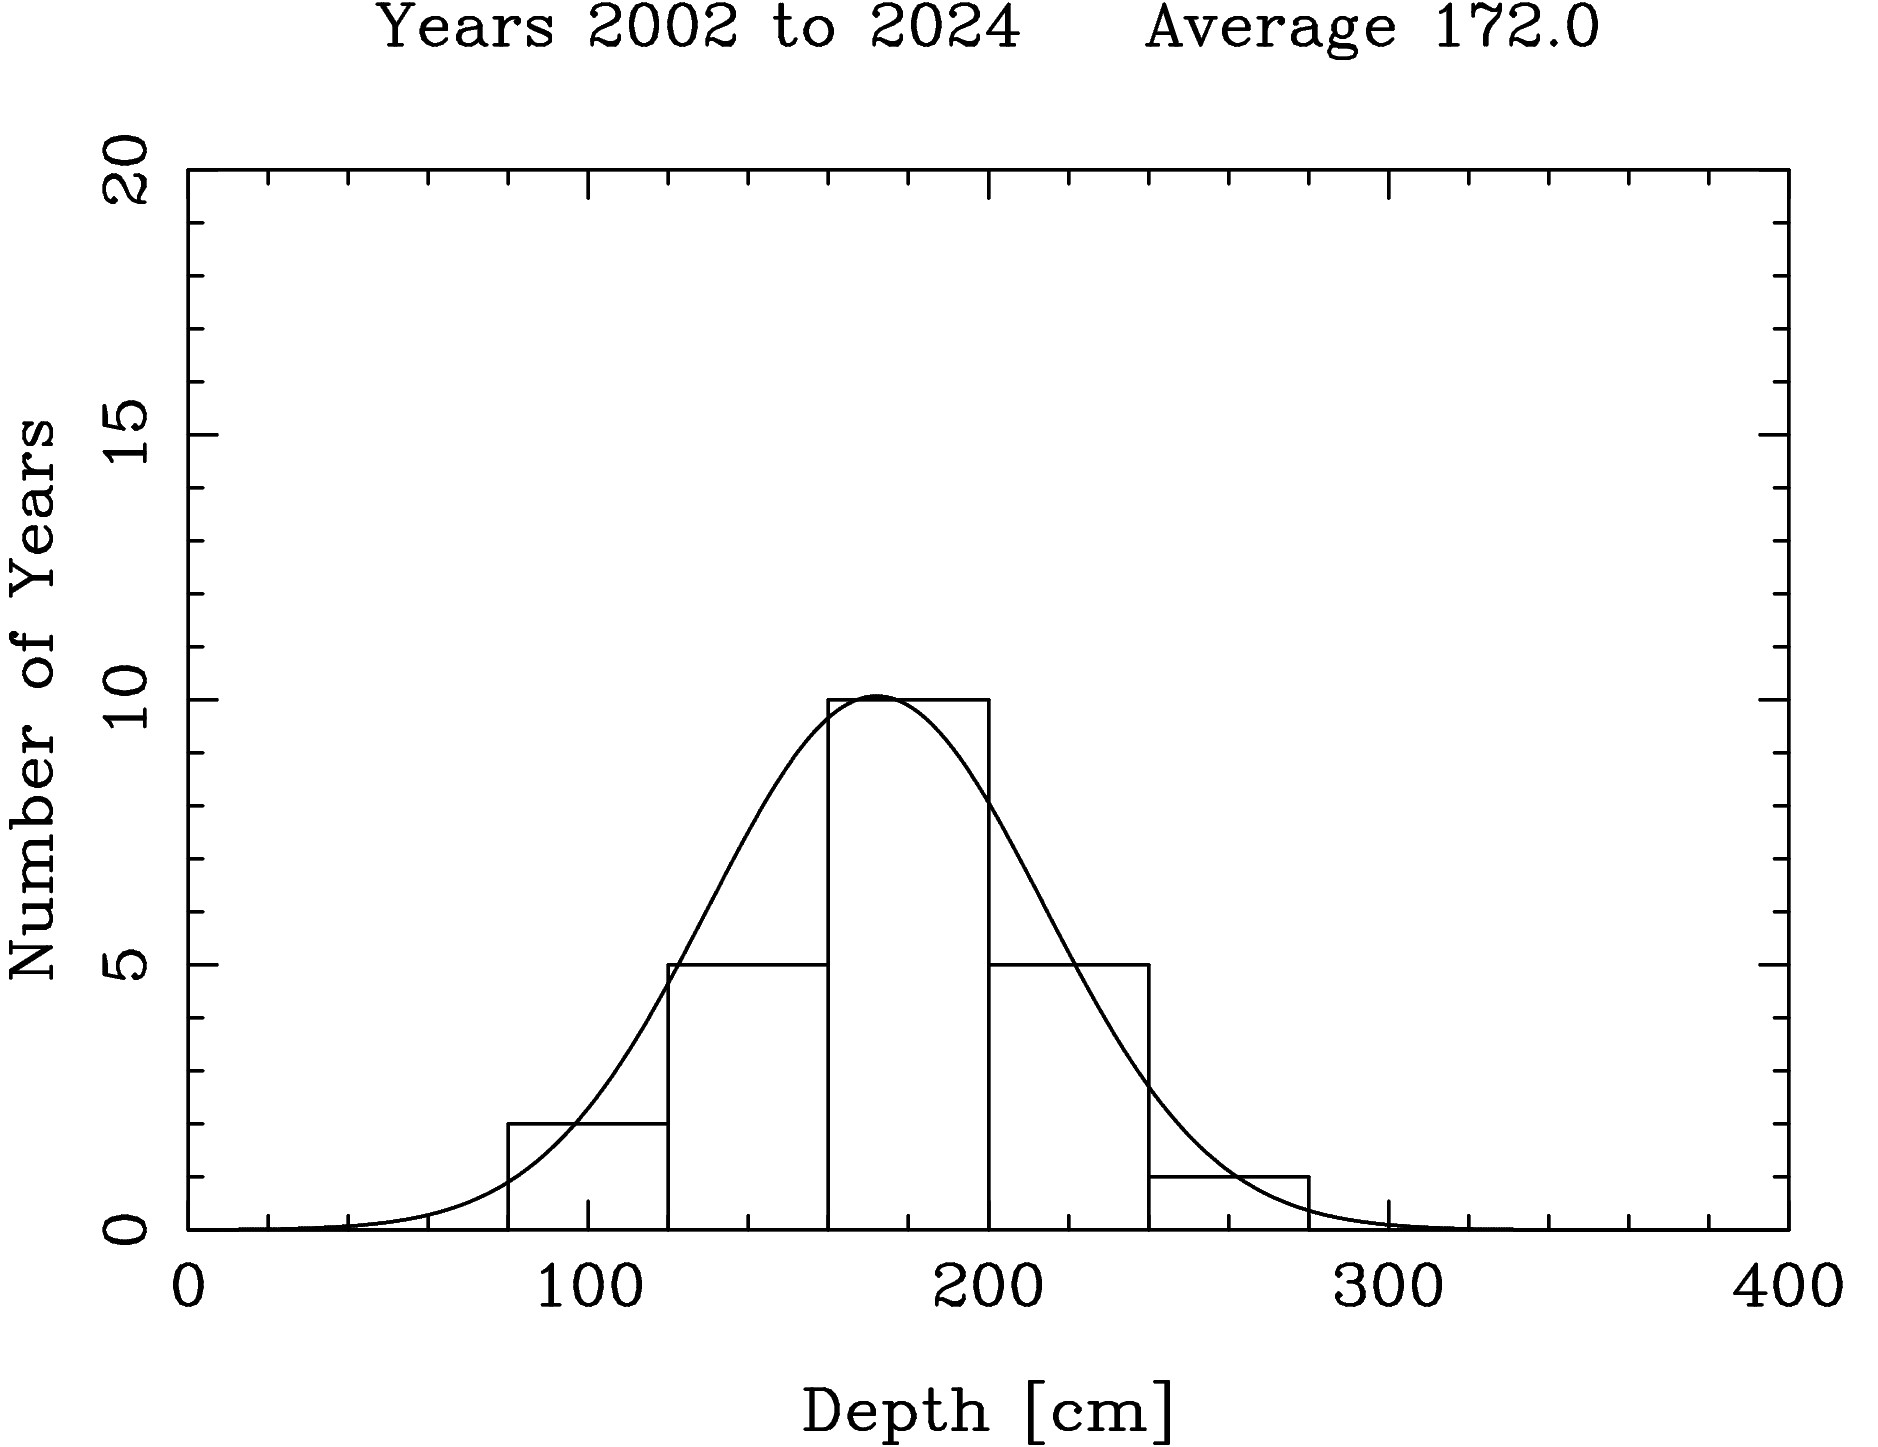
excess of years with high snowdepths, while the latest period (
2002-2024)
has a more random distribution of snowdepths peaked at
172.0 cm, and a smaller variance of 41.9 cm
|
Snow Depth Trends | |||||||
| (1) | (2) | (3) | (4) | (5) | (6) | ||
| Average | Variance | Median | 2-3 meters | > 3 meters | |||
| Years | cm | cm | cm | N | % | N | % |
| 1956-1978 | 213.2 | 65.8 | 192.3 | 8 | 35 | 3 | 13 |
| 1979-2001 | 198.4 | 70.0 | 173.7 | 7 | 30 | 2 | 9 |
| 2002-2024 | 172.0 | 41.9 | 170.5 | 6 | 26 | 0 | 0 |
|
Column 5 gives the number of years, and the percentage of years, in the
interval given in Column 1, where the maximum snow depth was between 2
and 3 meters.
Column 6 gives the number of years, and the percentage of years, in the
interval given in Column 1, where the maximum snow depth was above
3 meters. Fewer years had maximum snow depths above 3 meters in the
later periods, leading to a drop in the average and median depths, as
well as to a smaller spread in depths about the average. This can be
seen in the plots of the distributions as well as in the above table.
The Kolmogorov-Smirnov Test is used to obtain the probability that two data samples are drawn from the same underlying distribution.
First, I compare
the distribution of measured snow depths with a normal distribution
with the same average and variance as that found
for all the snow depth data.
This probability is inversely related to the maximum vertical separation
between the two lines in Figure 6.
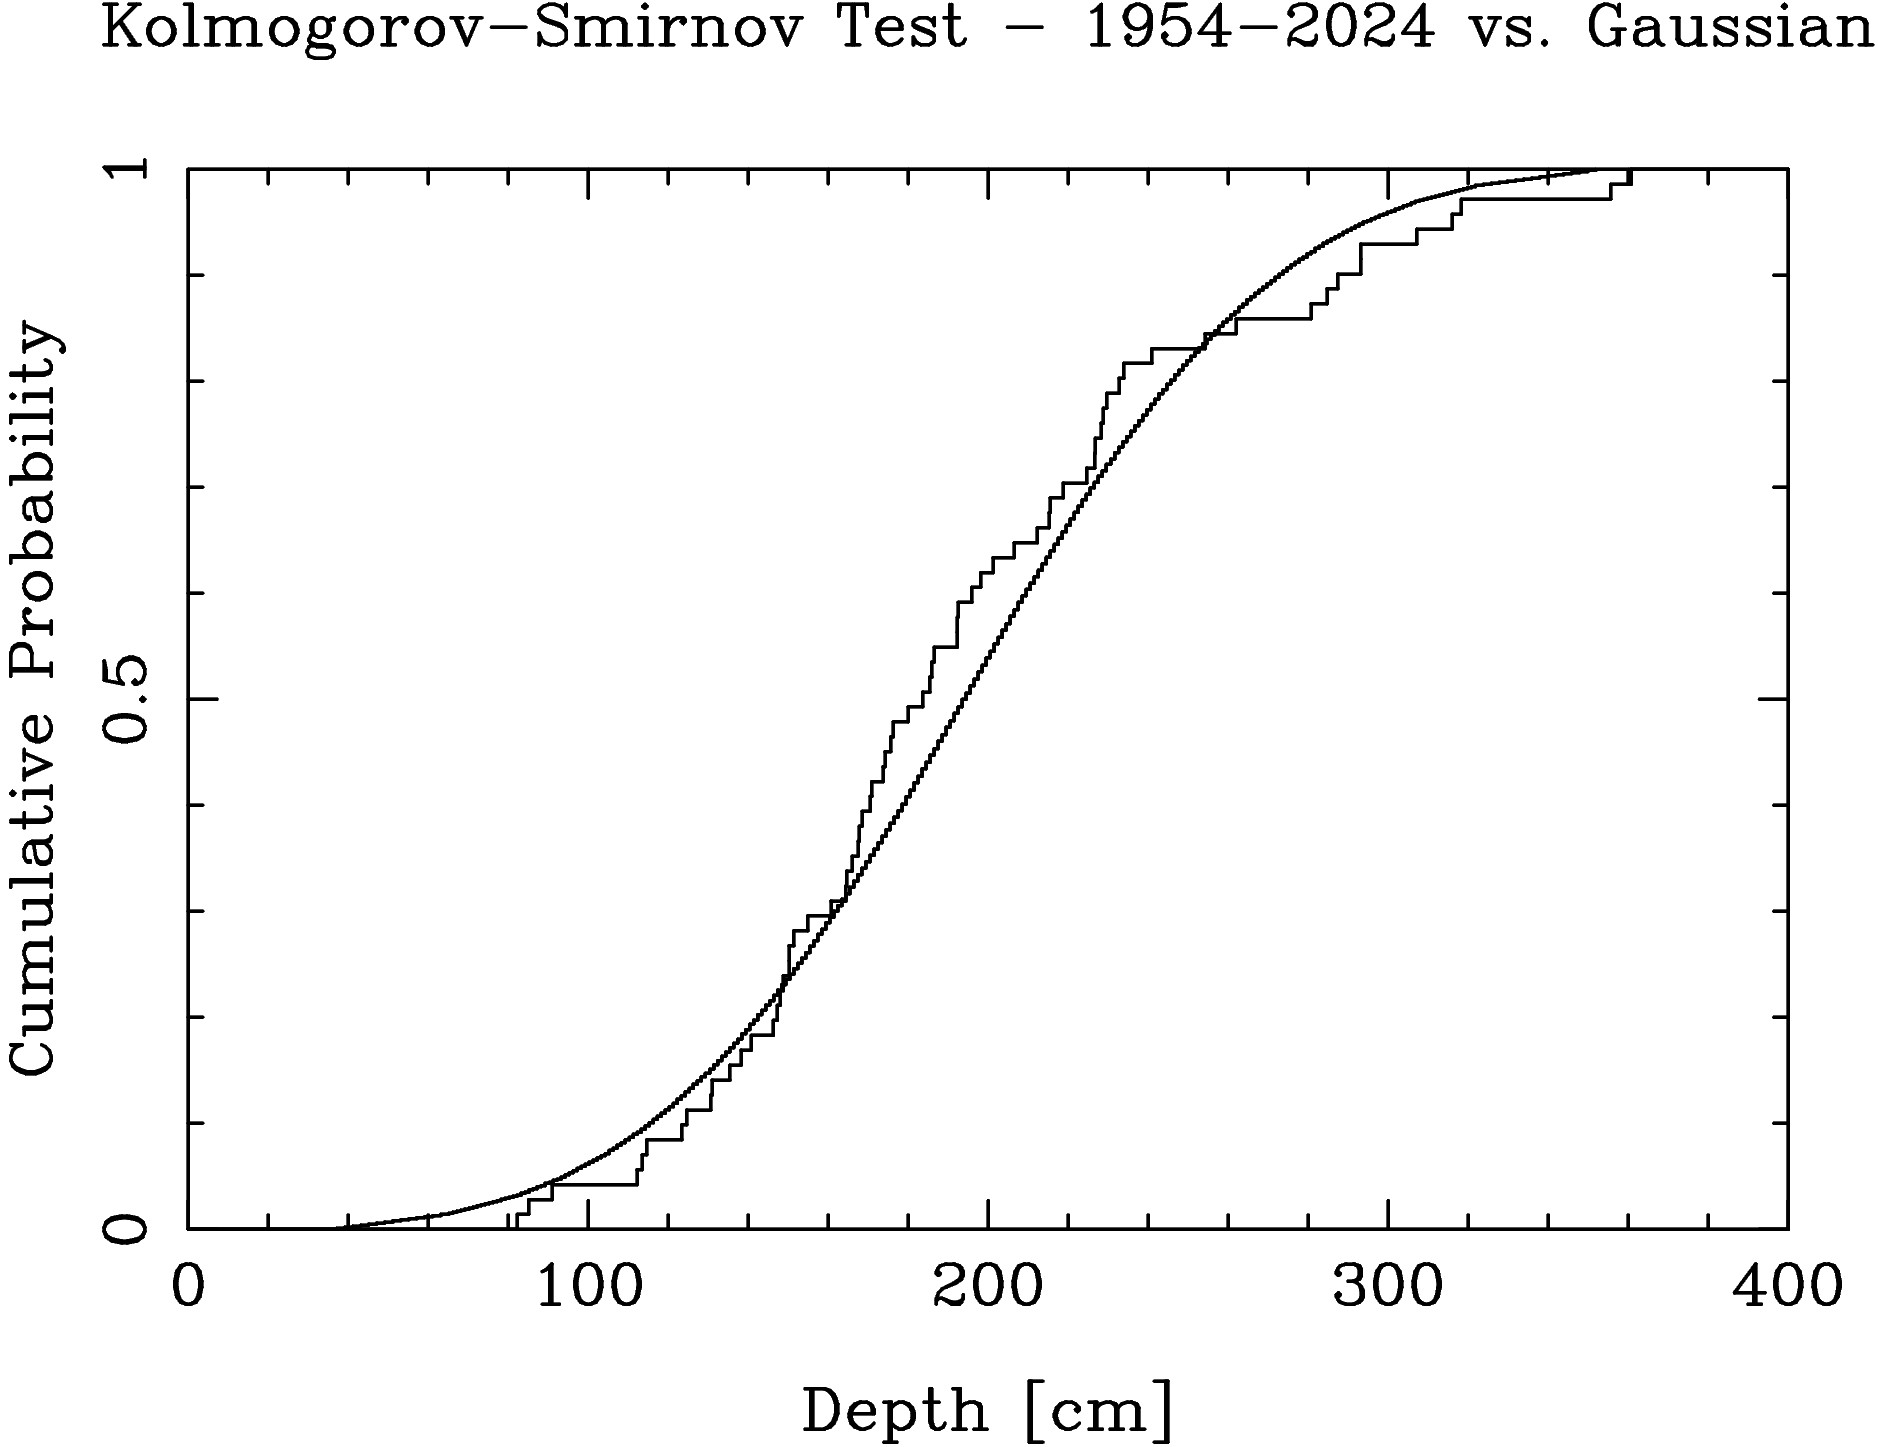
The result of the Kolmogorov-Smirnov Test is that there is 50.4%
probability that the snow depth distribution from 1954 through 2024
represents a
random distribution with average
193.9 and a standard deviation of
48.5 with no linear trend.
However, there is a clear difference between the early data and more
recent data, as seen in Figure 5 and the table of Snow Depth Trends.
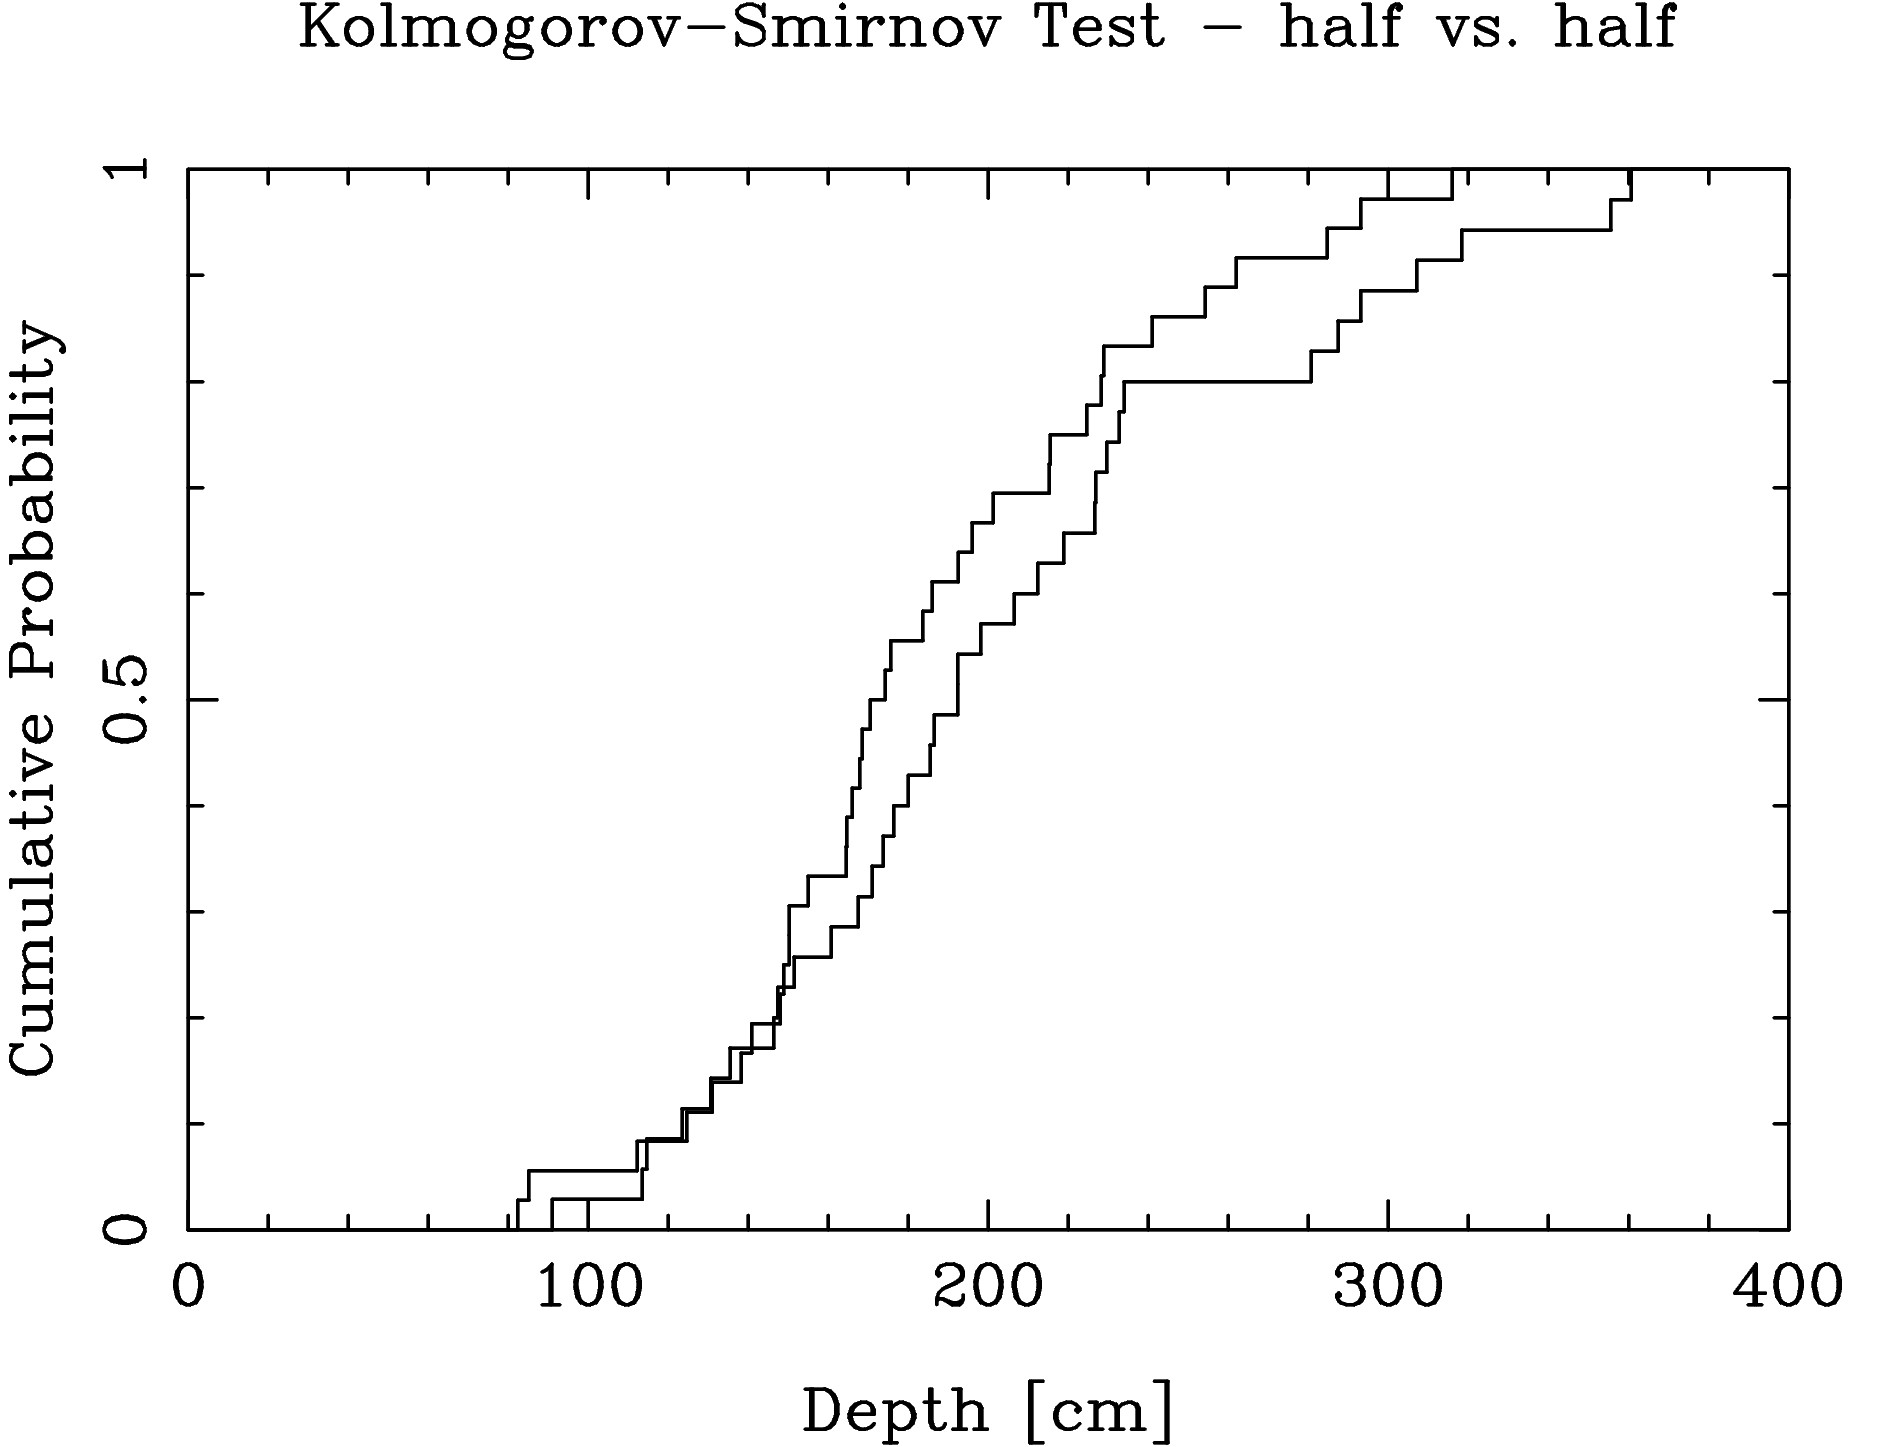 The result of this second Kolmogorov-Smirnov Test is that there is a 52% probability that the snow depth distribution from 1955-1989 comes from the same underlying distribution as the snow depth distribution from 1990-2024. The snow depth of the last 10 years has an average of 170.3 cm and a variance of 48.4 cm, as compared to the snow depth of the past 23 years, given in the table Snow Depth Trends, which has an average of 172.0 cm and a variance of 41.9 cm. I expect that snow depth for 2025 will not be much different than the average of the last 10 years, 170.3 cm, and perhaps only slightly lower than the linear trend, and higher than last year. |