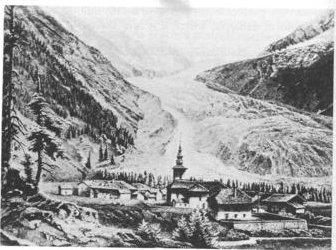
Argentiere Glacier 1850 etching
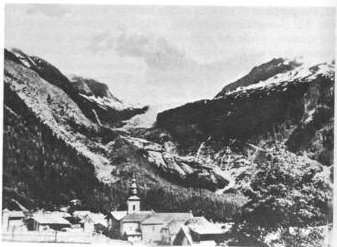
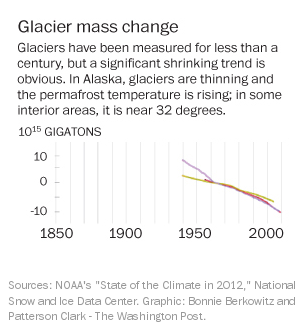
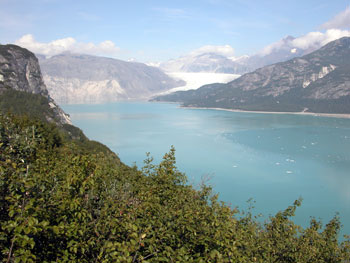
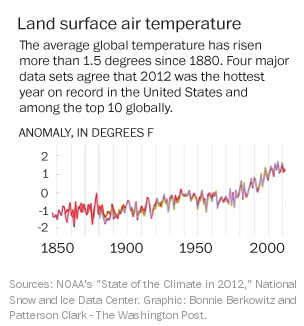
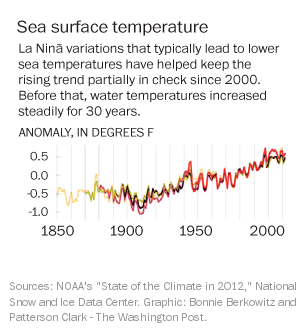
The climate of the Earth is slowly warming. Measuring changes in climate, which are small and gradual, is difficult because of the weather fluctuations that are much larger. However, the warming is apparent in weather records that span many decades. Other evidence is the melting of glaciers, the break up of ice shelves on the Antarctic peninsula, and the decline of north polar sea ice cover.
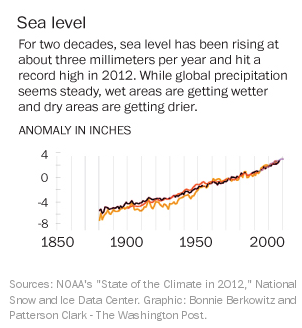
As the Earth warms, the water in the oceans will expand, and the
ice sheets in Greenland and Antarctica will melt and flow into the
oceans. The melting of the Greenland and Antarctic ice caps
will cause a rise in sea level of more than 60 meters (200 feet,)
displacing hundreds of
millions of people who live in coastal cities and river deltas. It is
difficult to predict how fast all this will happen.
|
||
|
Argentiere Glacier 1966 photograph |
|
Fig. 46, Imbre and Imbre 1979 |
||
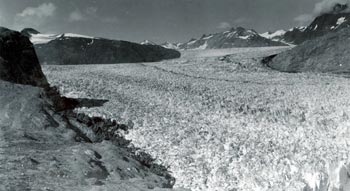
Muir Glacier 1941 |
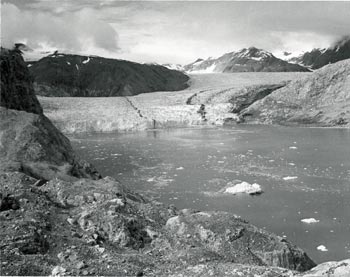
Muir Glacier 1950 |
Muir Glacier 2004 |
 |

|
|
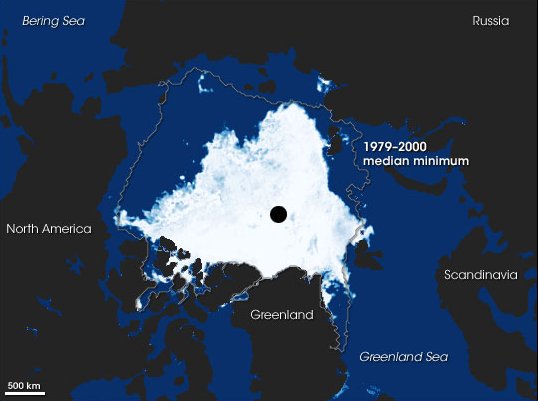
The 2008 minimum area of arctic sea ice compared with the 1979-2000 median minimum showing how the recent minimum coverage is much less than the 1979-2000 median minimum. |
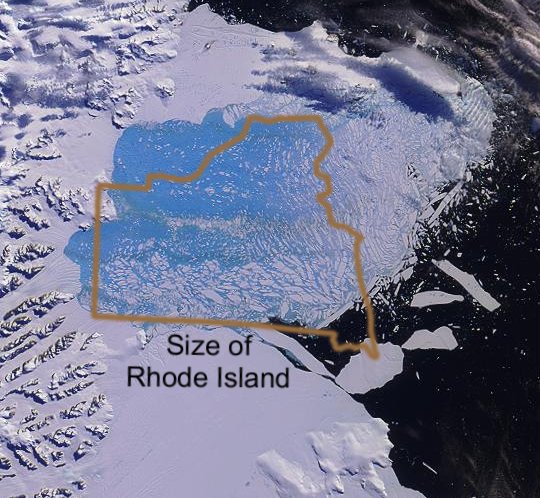
The shattered "Larsen B" Antarctic ice shelf compared to the area of the
state of Rode Island.
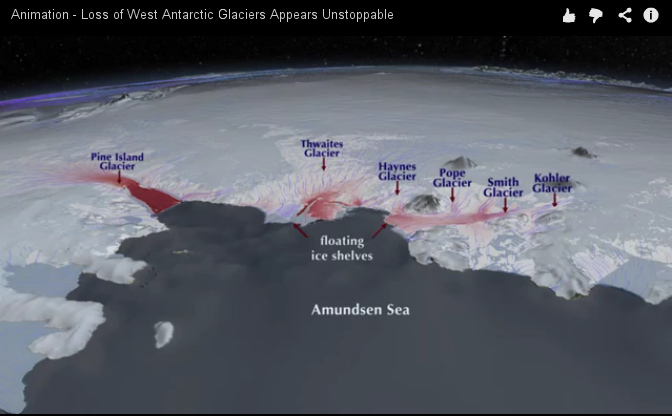
Red areas indicate increasing flow rates
Rignot and colleagues suggest that loss of the Amundsen Sea embayment glaciers appears inevitable. it remains extremely difficult to predict exactly how this ice loss will unfold and how long it will take. A conservative estimate is that it could take several centuries.
The Amundsen Sea region contains enough ice to raise global sea levels by 4 feet (1.2 meters). The most recent U.N. Intergovernmental Panel on Climate Change (IPCC) report estimates that by 2100, sea level will rise somewhere from just less than 1 foot to about 3 feet (26 to 98 centimeters). But the vast majority of these projections do not take into account the possibility of major ice loss in Antarctica. Rignot said this new study suggests sea level rise projections for this century should lean toward the high-end of the IPCC range.

|
In the Antarctic, the area covered by sea ice has increased in recent years. The fresh water from the melting glaciers on the Antarctic continent flows into the salt water surrounding the continent, allowing the sea water to freeze at a higher temperature, thus extending the area of the ice cover. |
 |
 |
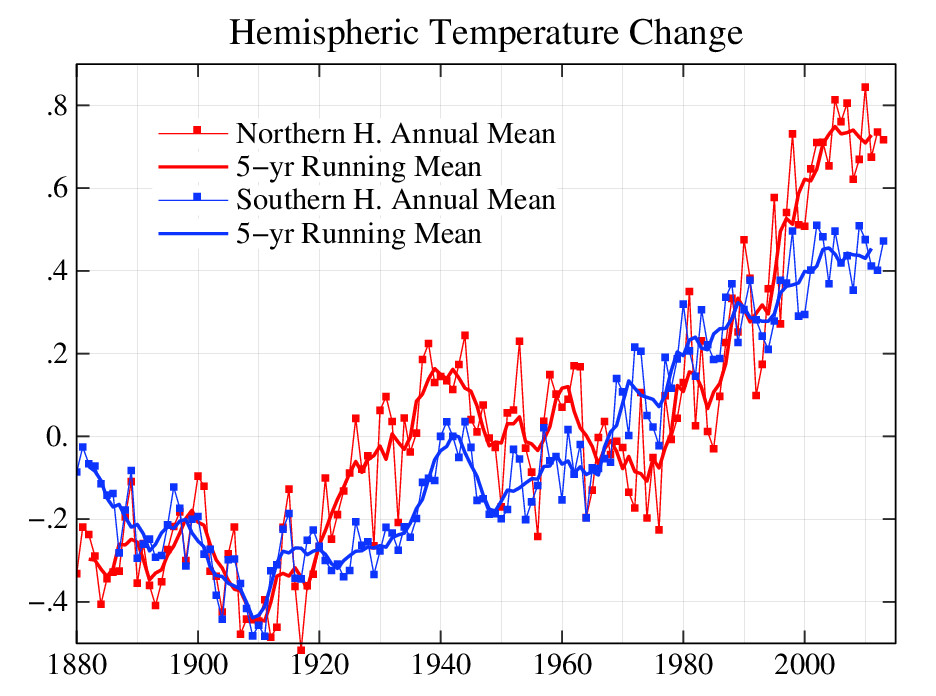
Ref: http://data.giss.nasa.gov/gistemp/graphs_v3/Fig.A3.psDifferent types of ocean currents carry heat from the tropics to the pole in the different Hemispheres. |
|
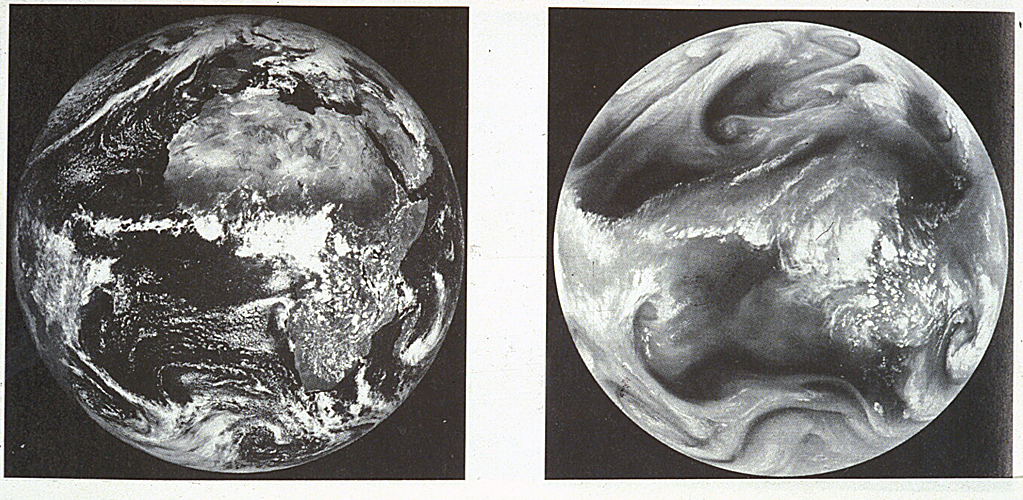
The Earth in visible light on the left, and infra-red light on the right.
Clouds, the surface of the ocean, and Africa can be seen in visible light.
In infrared light, the surface is obscured by H2O and
CO2 absorption, and only the cloud tops can be seen.
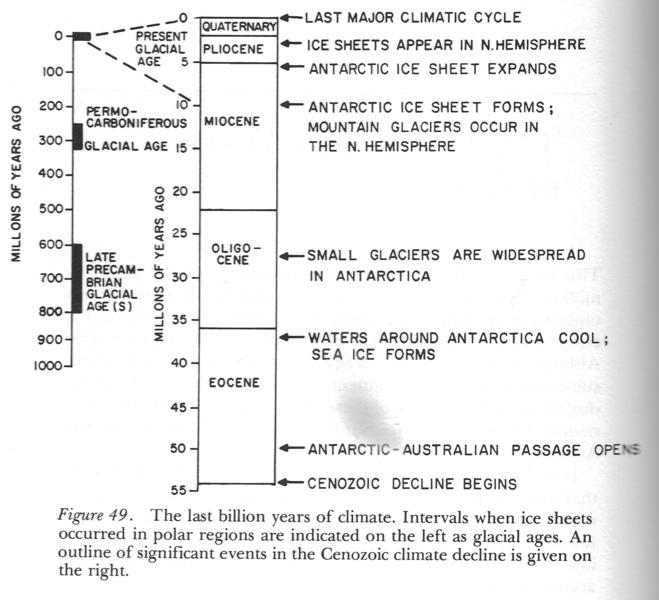 Fig. 49 from Imbre and Imbre, 1979 |
We know that the Earth was warmer in the past, the Antarctic ice sheet
was not present, and the carbon dioxide levels then were also high.
We have accurate measurements that show that carbon dioxide levels in the atmosphere have been increasing over the last half century. We know that burning fossil fuels (coal, oil, and natural gas) produces carbon dioxide that is released into the atmosphere. We know that carbon dioxide is a greenhouse gas. However, it is difficult to predict how much warming a given amount carbon dioxide will produce, and how fast the warming will occur. |
|
|
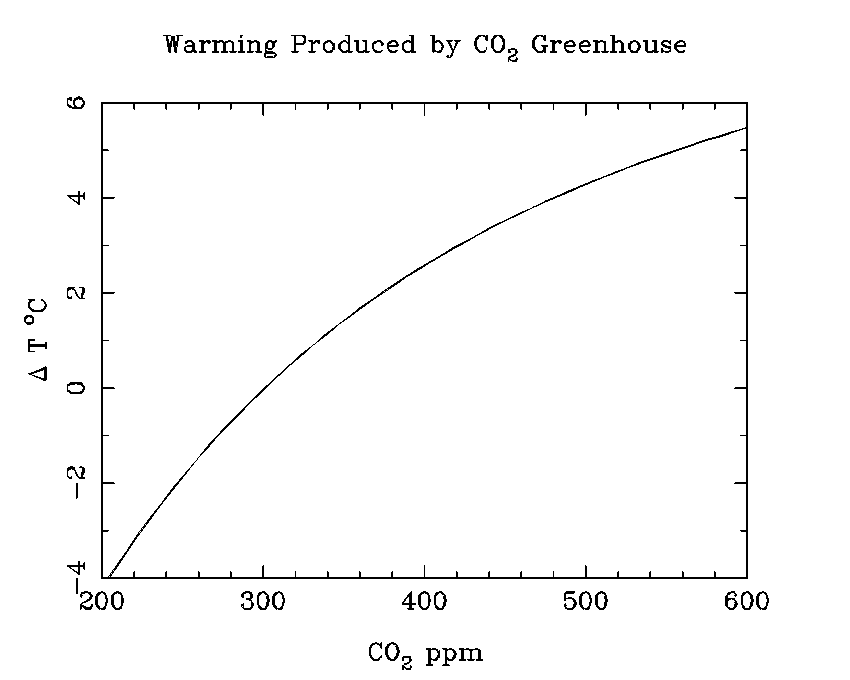
On the left is a graph of temperature change vs. atmospheric carbon dioxide in parts per million (ppm). It was calculated using data for the decrease in infrared transmission produced by increasing carbon dioxide, and increasing the Earth's temperature so that the flux of radiation from the Earth at the new temperature would still balance the flux absorbed from the Sun. |
In the 1830s, at the start of industrialization, the carbon dioxide levels were around 280 ppm. Now they are almost 400 ppm (392 ppm in November 2011). This simple calculation shows an expected increase in temperature of 2.6 degrees as atmospheric carbon dioxide increases from 300ppm to 400ppm. However, this calculation does not consider the effects of the increase in atmospheric water vapor that higher temperatures would produce. On the one hand, water vapor is a greenhouse gas, and would decrease the infrared transparency and increase the greenhouse heating. On the other hand, more atmospheric water vapor would produce more clouds which reflect the solar radiation back into space and reduce the heating from the sun. |
|
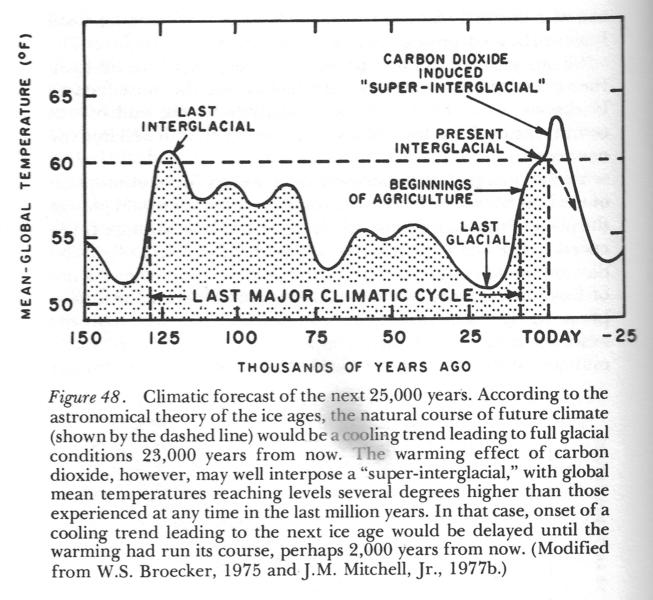
Fig. 48 from Imbre and Imbre, 1979 |
We know that the ice ages were caused by small changes in the orbit of the Earth produced by perturbations from the other planets. These orbital changes caused less sunlight to fall at high latitudes, with the result that the winter snow could not melt completely in summer, and accumulated to form ice sheets. At present, the orbital changes should be producing cooling, but the Earth is warming because the greenhouse gas that we are producing is overwhelming the natural cooling effect. |
Our modern lifestyle requires large amounts of cheap energy, and burning fossil fuels gives us cheap electricity, and cheap energy for transportation and industry.
We must stop burning fossil fuels. The best choice is to find alternative sources of energy for our electricity, transportation, and industry. We could also reduce our energy requirements by reducing the amount energy each person consumes, or by reducing the number of people consuming energy.
Nuclear Power is not a solution.
If we do not act now to implement alternative sources of energy, Global Warming will reduce our population and force a primitive living standard upon us.